Why Mistaking a Storyboard for a Story Map Is Sabotaging Your Release Scope
It is 11:45 PM on the eve of a major Q3 software release. The development team has worked tirelessly for six weeks, checking off every user interface box and polishing every pixel. The design mockups look flawless. Yet, during the final staging review, a catastrophic realization hits the room: while the individual screen workflows are beautiful, the cross-functional data does not flow sequentially from the customer intake page to the backend fulfillment architecture. The application is a collection of gorgeous, disconnected islands. The launch is postponed, stakeholder trust evaporates, and the team faces immediate burnout.
This nightmare is entirely preventable. It happens because modern product teams routinely fall prey to a dangerous corporate myth: the belief that all visual planning tools are interchangeable.
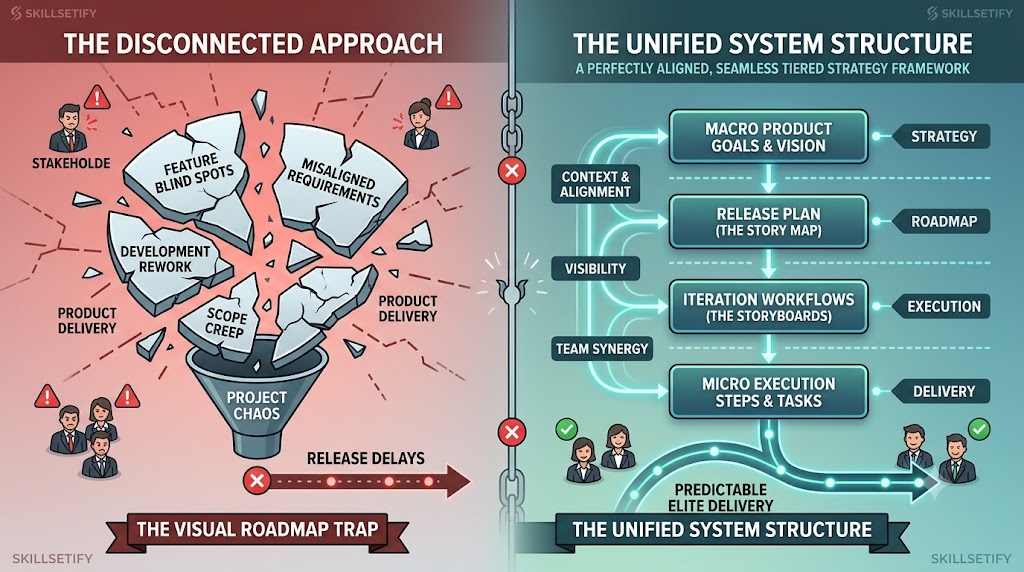
In high-stakes enterprise project management, mixing up a storyboard with a story map is one of the quickest ways to introduce massive scope creep and operational misalignment. Both are vital visual artifacts, but they serve completely different masters. One manages the macro scope of your long-term product roadmap across multiple releases, while the other maps the micro visual graphic workflows within a single iteration.
If you want to protect your delivery timelines, you must understand exactly where the roadmap ends and the iteration workflow begins.
Demystifying the Visual Hierarchy: What Is a Story Map vs. a Storyboard?
To manage modern, high-velocity initiatives, enterprise project leaders must establish a rigid visual hierarchy. Without clear definitions, project requirements become muddy, engineering teams misinterpret technical goals, and business stakeholders lose visibility.
The Story Map: Architecting the Macro Product Scope
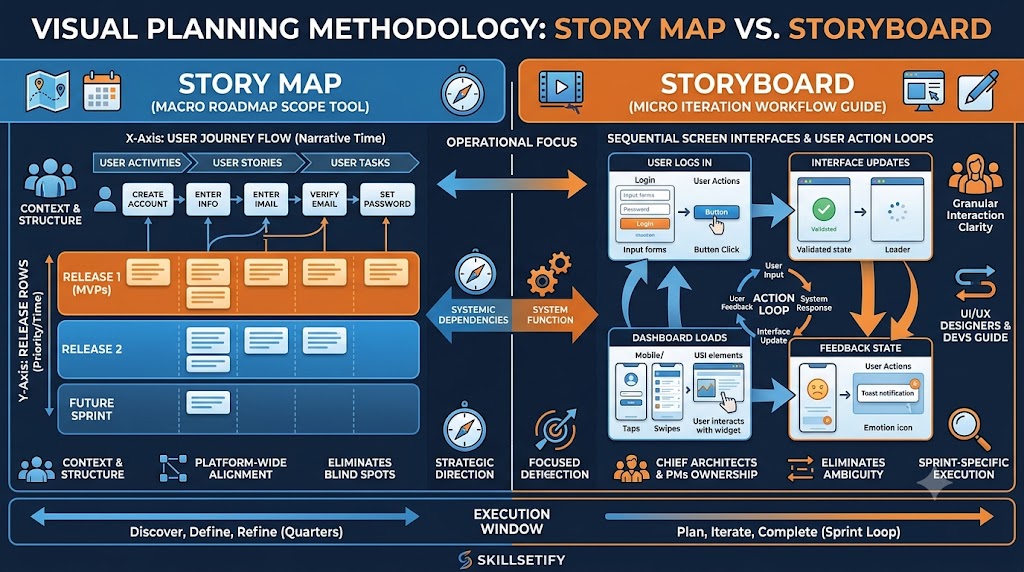
Invented as a foundational tool for agile product discovery, a story map is a comprehensive visual arrangement of a product backlog. It is organized along two distinct axes to establish context at a glance. The horizontal axis represents the user journey sequence over time, often referred to as the product backbone. The vertical axis represents critical prioritization and release categorization.
When building a story map, the project team maps out the entire customer lifecycle from left to right. They start with macro activities such as user authentication or data ingestion and break them down into specific functional steps. Vertically, these steps are categorized into distinct delivery slices: Release 1, Release 2, and future iterations.
A story map is explicitly designed to track the broader product roadmap scope. It ensures that the Minimum Viable Product contains a fully functional, end-to-end slice of value, rather than a top-heavy collection of non-essential features.
The Storyboard: Engineering the Micro Graphic Workflow
A storyboard borrows its philosophy from filmmaking and user experience design. It is a sequential series of visual illustrations, graphic panels, or mockups that detail how a user interacts with a specific system function under a tight context.
Unlike the macro lens of the story map, a storyboard zooms in completely on an individual screen interaction, a particular state change, or a tight script within a single iteration. It displays the step-by-step graphic workflow, detailing what the user sees, what actions they take, and how the interface responds instantly to their input.
A storyboard does not try to establish a multi-month release plan. Instead, it serves as a hyper-focused behavioral specification tool that developers and designers use to ensure a flawless experience within an isolated iteration loop.
The Core Mechanics: Scope Alignment vs. Iteration Execution
Understanding the difference between these two tools requires analyzing their functional mechanics, operational timelines, and ultimate ownership structures. The following breakdown outlines how these visual tools operate in a live corporate setting:
| Functional Parameter | The Story Map | The Storyboard |
| Primary Focus | Macro roadmap scope, feature prioritization, and multi-release alignment. | Micro visual graphic workflows, interface states, and user interaction mechanics. |
| Operational Axis | Horizontal axis represents narrative time: vertical axis represents release priority layers. | Linear sequence of panels representing real-time UI changes and user emotional touchpoints. |
| Execution Window | Created during initial product discovery: updated continuously across quarters. | Created during iteration planning: executed and completed within a single sprint loop. |
| Core Value | Eliminates blind spots in the systemic architecture: prevents fragmented feature delivery. | Eliminates ambiguity in the user experience: explicitly guides UI engineering tasks. |
| Key Stakeholders | Product Owners, Enterprise PMs, Business Sponsors, and Chief Architects. | UI/UX Designers, Front-End Developers, and Quality Assurance Engineers. |
When a project manager mistakenly treats a storyboard as a roadmap tool, the team loses sight of the systemic dependencies across the broader platform. Conversely, trying to use a story map to solve micro interaction questions leaves engineers without the granular visual clarity needed to construct pristine front-end code.
The Unified Visual Framework: A Step-by-Step Implementation Guide
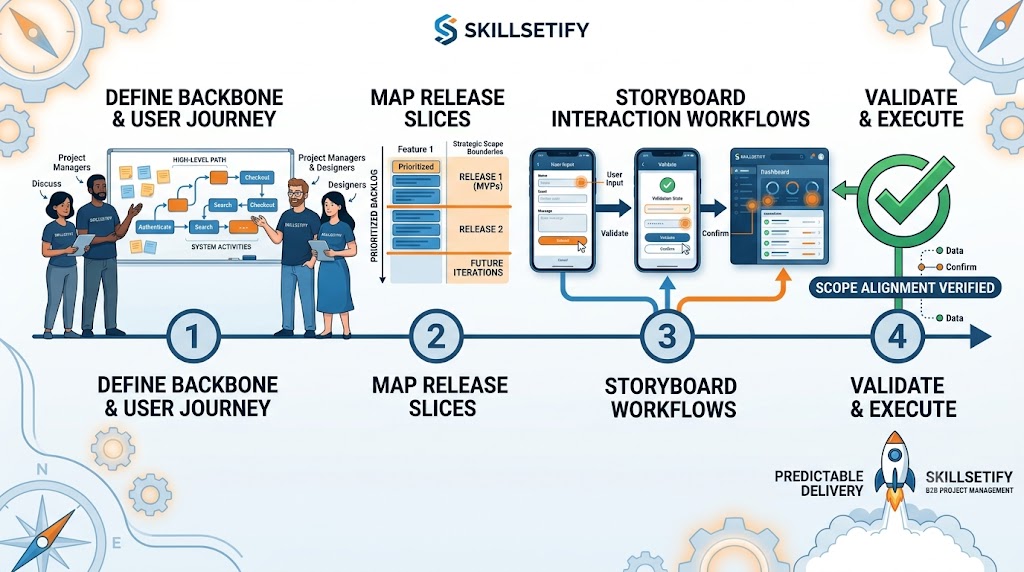
To achieve predictable delivery metrics, elite project managers do not choose between a story map and a storyboard. Instead, they run them sequentially within a unified execution framework. The following step-by-step guide explains how to deploy this process inside your organization:
Step 1: Establish the Product Backbone (Story Mapping)
Begin by gathering your core business sponsors, product managers, and engineering leads for a mapping workshop. Lay out the horizontal axis of your story map by identifying the chronological activities your user must take to realize value from your system.
Keep these activities high level. Focus on broad user goals such as account creation, inventory selection, payment processing, and confirmation delivery.
Step 2: Slice the Backlog into Strategic Releases
Once the backbone is stable, populate the vertical columns beneath each activity step with detailed user stories. Once the backlog is fully visible, draw horizontal partition lines across the map to establish your release boundaries.
The top layer must contain the absolute minimum functionality required to create a working system. Lower layers represent fast-follow enhancements reserved for subsequent release packages. This step sets your firm roadmap scope boundaries.
Step 3: Script the Iteration Workflows (Storyboarding)
As an individual release slice moves into active development cycles, pull the high-priority user stories into your upcoming iteration plan. This is the moment to transition from macro mapping to micro storyboarding.
Have your design and development teams take a single high-impact card from the current release row and construct a detailed panel-by-panel storyboard. This board must explicitly illustrate the exact interaction path, input validations, and screen transitions the customer faces.
Step 4: Validate and Close the Execution Loop
Before writing any production code, cross-reference your new storyboard directly back to your parent story map. Ensure that the micro workflows designed inside the iteration do not alter the broader scope boundaries defined on the roadmap.
Once verified, hand the storyboard to your engineering and QA teams. It serves as a visual guide for development and an objective checklist for automated test scripts.
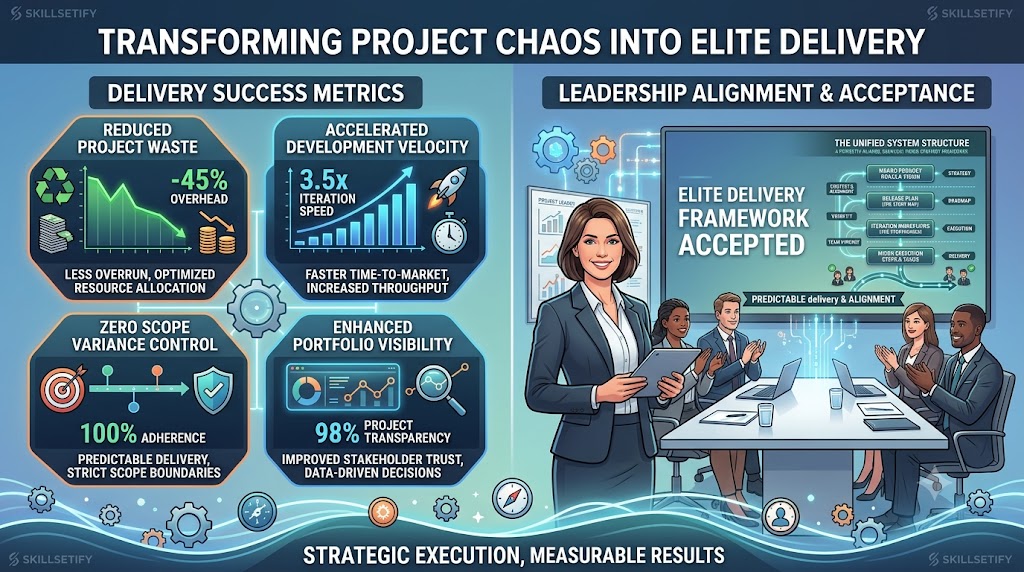
The Professional Transformation: From Project Chaos to Elite Delivery
When you implement this balanced visual strategy correctly, the cultural shift inside your engineering organization is immediate. The operational friction that typically bogs down enterprise initiatives begins to disappear:
Elimination of Scope Creep: By using a story map to establish hard vertical release lines, business stakeholders can visually see how adding a new request pushes other initiatives down the priority list. This makes scope management natural and visual.
Minimized Development Rework: When engineers receive a clear storyboard before an iteration begins, they do not have to guess about user behavior or design intent. They write clean, accurate code on the first pass, cutting your development cycle times significantly.
Optimized Team Utilization: Designers can focus on producing micro workflows exactly when developers need them, rather than building massive, speculative mockups that may change before launch.
For an ambitious project manager, mastering this visual hierarchy completely changes your career trajectory. You stop functioning as a clerical task tracker who spends their day chasing developers for updates. Instead, you step into the role of a strategic organizational coordinator: an elite leader who translates high-level corporate goals into clear, predictable delivery steps.
Scaling Your Delivery Strategy with Skillsetify
Navigating the complex realities of modern enterprise roadmaps requires more than basic project templates. It demands an advanced understanding of how to translate high-level business logic into predictable, rapid execution loops.
Understanding the differences between macro planning structures and micro iteration assets is an important step, but true career advancement requires hands-on, strategic mastery of these frameworks.
If you are ready to stop guessing, move up the corporate ladder, and learn project management the right way, reach out to Skillsetify. We do not just teach frameworks: we show you your exact career growth trajectory. Through elite mentoring and deeply researched methodology models, we provide the strategic toolsets you need to eliminate delivery blockers, lead high-performing teams, and secure executive-level promotions. Connect with Skillsetify today, and transform your tactical execution skills into a powerful corporate advantage.