How Financial Metrics Separate Elite Project Managers from Operational Task Trackers
It is 4:00 PM on a Friday. The executive steering committee is sitting around a polished conference table, reviewing two competing capital project proposals. Project Alpha promises a sleek, user interface modernization with a projected cost of $1.5 million. Project Beta proposes an automated backend data pipeline refactoring with an identical price tag of $1.5 million.
Both project managers pitch their initiatives with unbridled passion. Alpha’s manager highlights intuitive user flows and team excitement. Beta’s manager talks about reduced system latency and technical elegance.
Then, the Chief Financial Officer asks one decisive question: “When do we recover our cash outlay, and what is the risk-adjusted Net Present Value of each project over a five-year horizon?”
Silence fills the room. Neither project manager has the answer.
This scenario plays out across enterprise organizations daily. A dangerously common corporate myth persists: project managers only need to focus on scope, schedule, and tactical execution, while finance teams handle the money.
In reality, elite project leaders do not wait for funding to be handed to them on a platter. Every strategic initiative begins with an initial idea that must be verified through a business case evaluating financial viability and technical feasibility. Understanding capital budgeting techniques: such as Return on Investment, Payback Period, Net Present Value, and Break-Even Points: is what transforms a tactical task tracker into a high-impact corporate strategist.
The Core Mechanics of Capital Budgeting in Business Case Validation
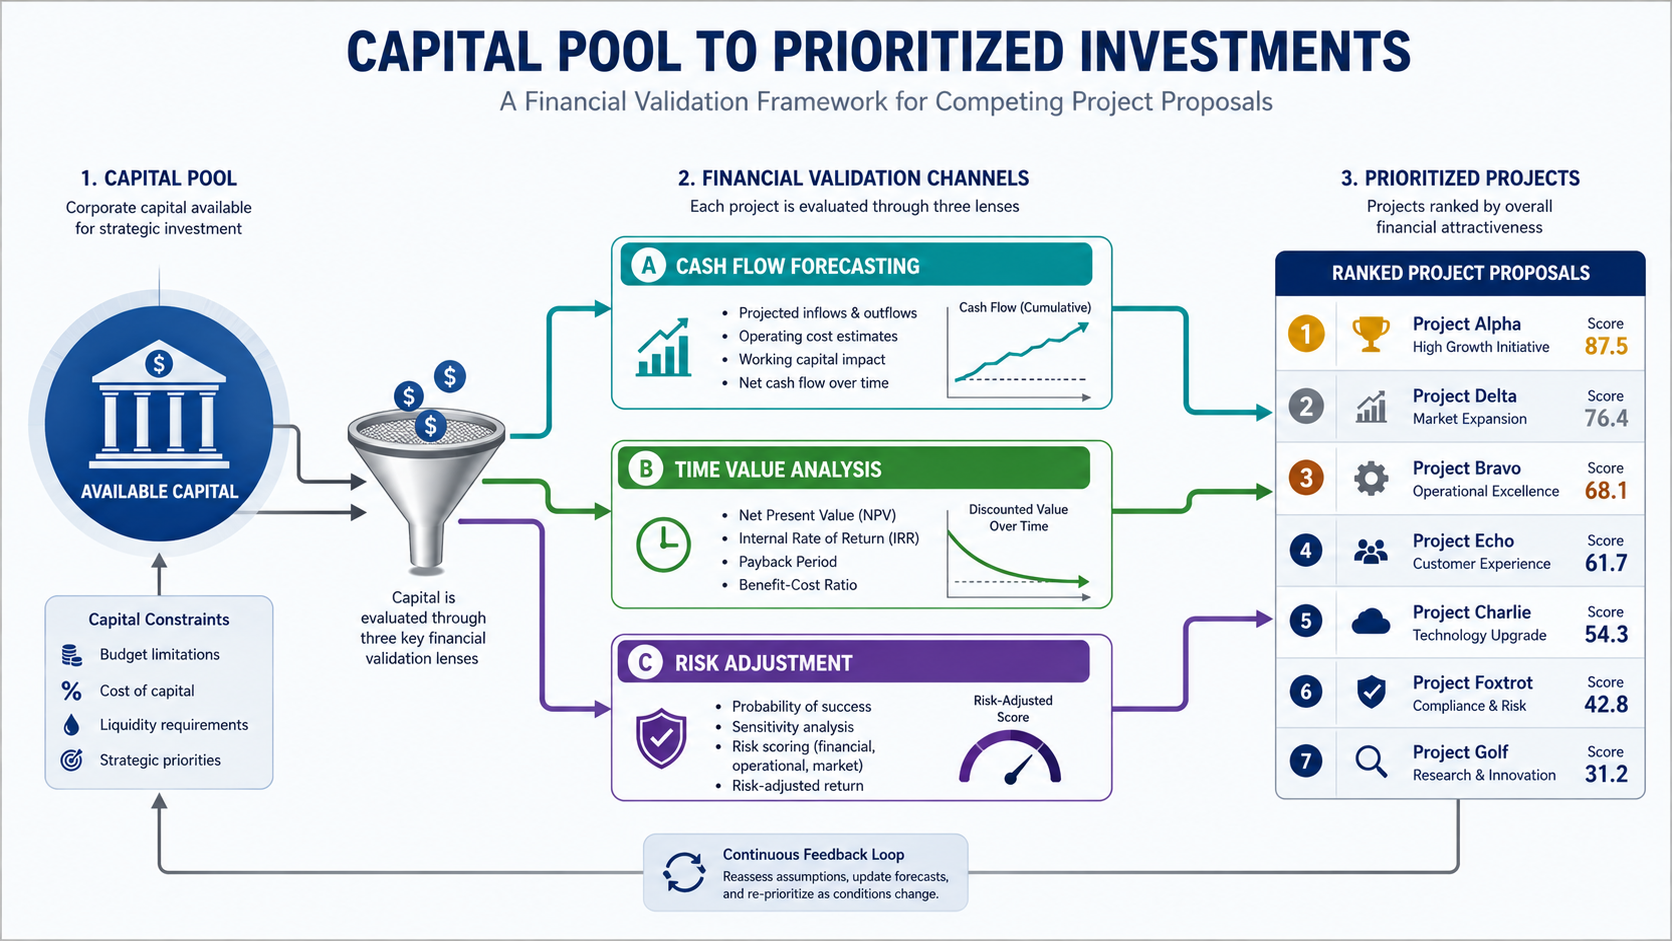
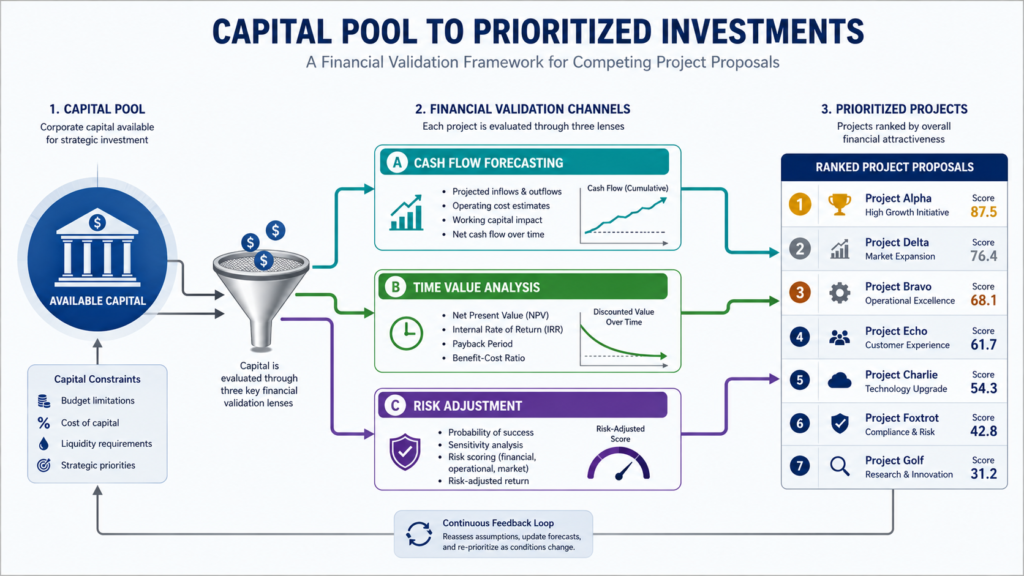
Capital budgeting is the formal evaluation framework organizations use to quantify, compare, and rank long-term capital investments. In an enterprise environment where financial resources and engineering bandwidth are strictly finite, capital budgeting serves as the ultimate gatekeeper for project survival.
When two or more projects compete for the same capital pool, emotional arguments, executive pet projects, and surface-level enthusiasm must be replaced by objective financial metrics.
The Essential Financial Metrics Every Project Manager Must Master
To build an airtight business case, project managers must master five essential financial evaluation metrics:
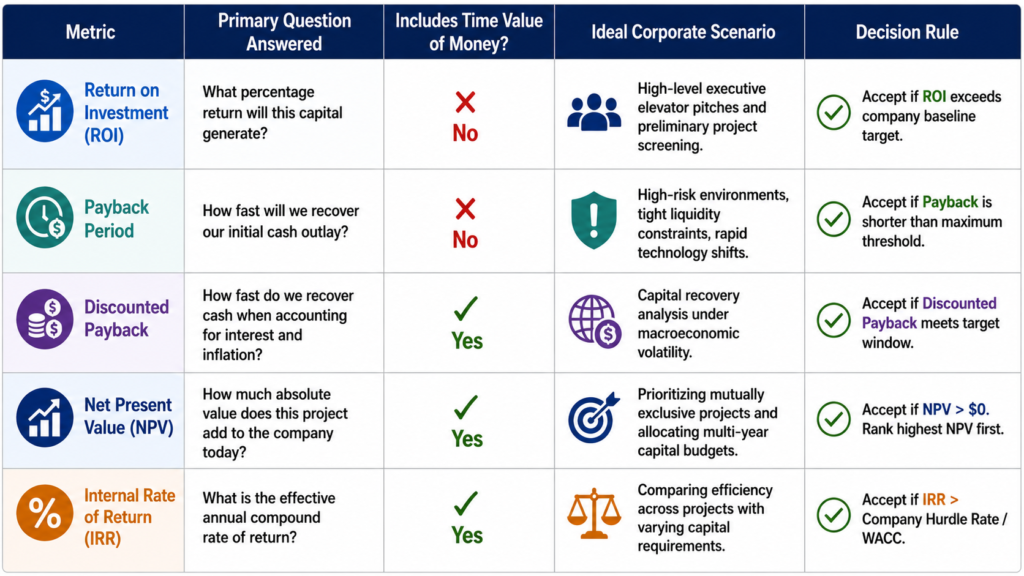
1. Return on Investment (ROI)
ROI measures the overall profitability of an investment relative to its initial cost. Expressed as a percentage, it provides a quick snapshot of financial efficiency.
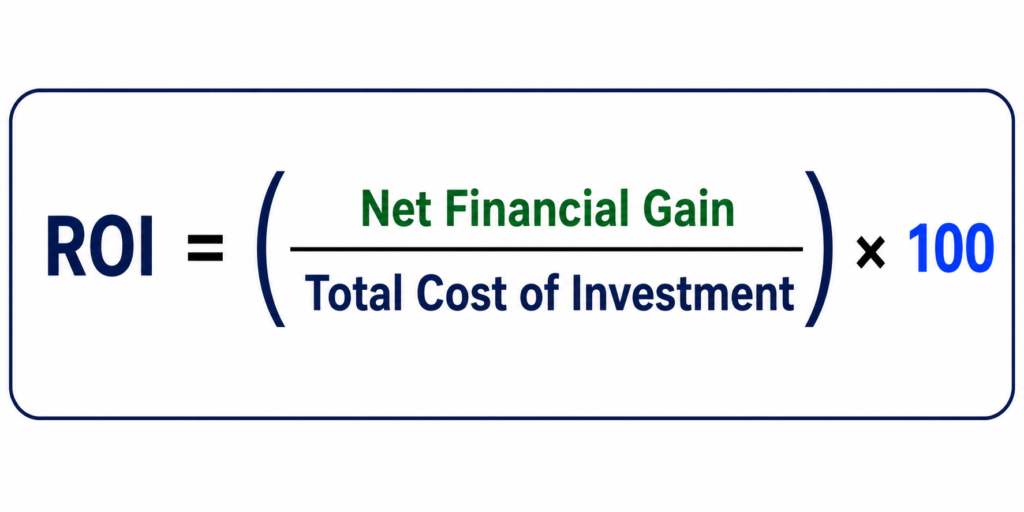
While ROI is intuitive and easy to communicate to non-financial stakeholders, it carries a major limitation: it ignores the time value of money. An ROI of 30% achieved over ten years is vastly different from a 30% return achieved in eighteen months.
2. Payback Period and Discounted Payback Period
The Payback Period calculates the exact duration required for a project’s cumulative cash inflows to equal its initial cash outlay.
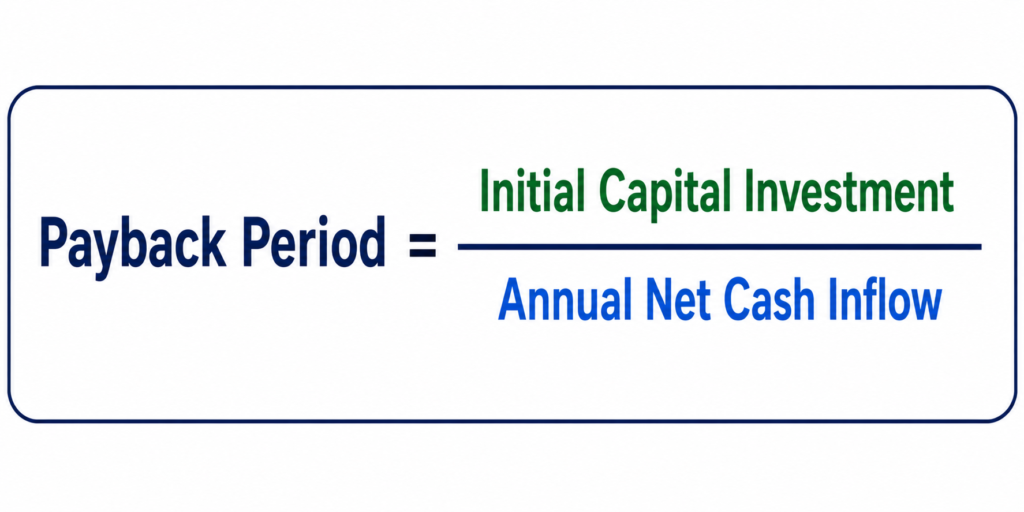
For organizations prioritizing liquidity or navigating rapid market disruption, a shorter payback period reduces exposure to long-term risk. However, traditional payback calculations ignore cash flows generated after the payback point.
To correct this, project leaders use the Discounted Payback Period, which discounts future cash inflows back to their present value before calculating capital recovery time.
3. Break-Even Point (BEP)
The Break-Even Point defines the precise threshold where total project revenue or cost savings equal total project expenditures. Beyond this point, every unit of output or operational efficiency generates net profit.
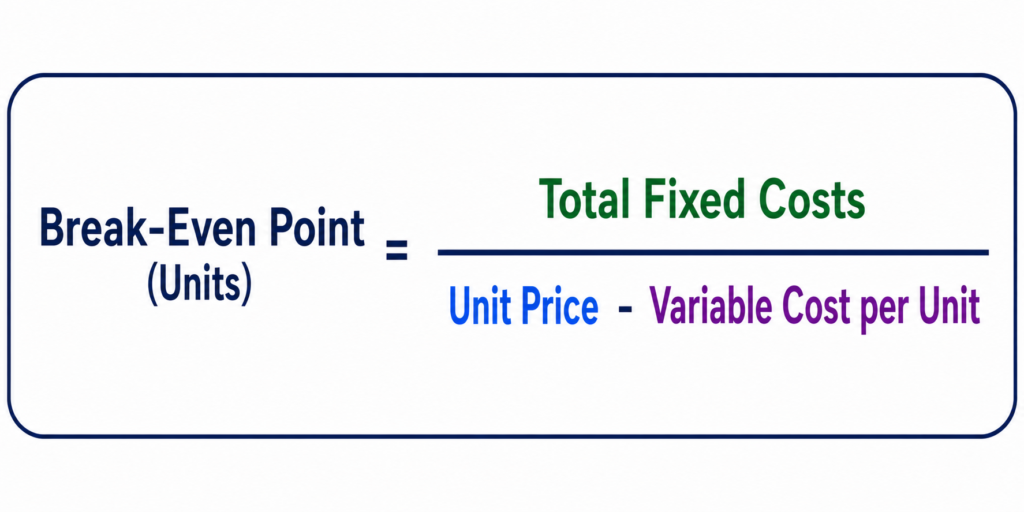
In internal IT or process improvement initiatives where direct unit revenues do not exist, break-even analysis shifts to operational cost-reduction targets, identifying how many hours or process cycles must be automated to offset setup costs.
4. Net Present Value (NPV)
Net Present Value is the gold standard of capital budgeting. It calculates the current value of all future cash inflows and outflows associated with a project, using a specific discount rate (typically the organization’s Weighted Average Cost of Capital, or WACC).
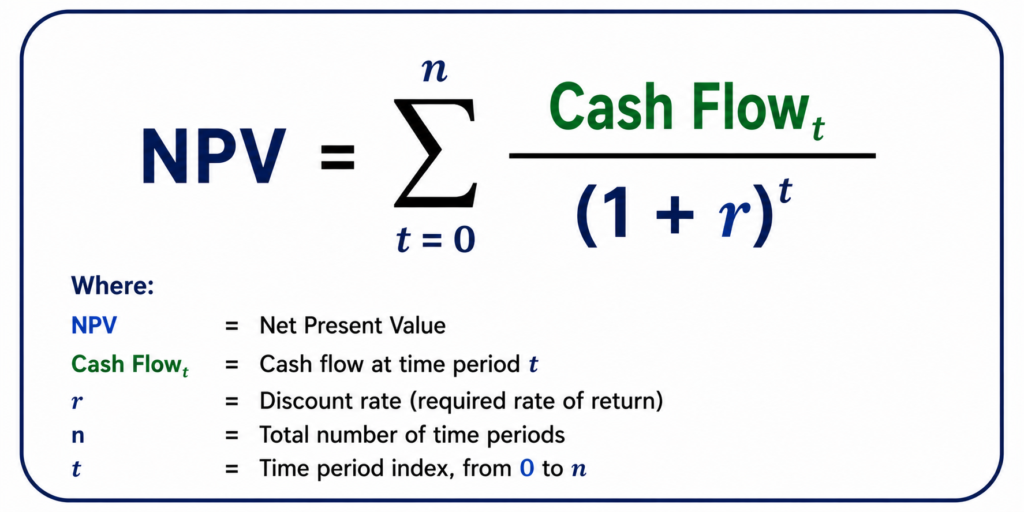
An NPV greater than zero indicates that the project adds measurable financial value to the firm above its cost of capital. When ranking mutually exclusive projects, the project with the highest positive NPV should always take precedence.
5. Internal Rate of Return (IRR)
The Internal Rate of Return is the discount rate that sets the Net Present Value of all cash flows equal to zero.
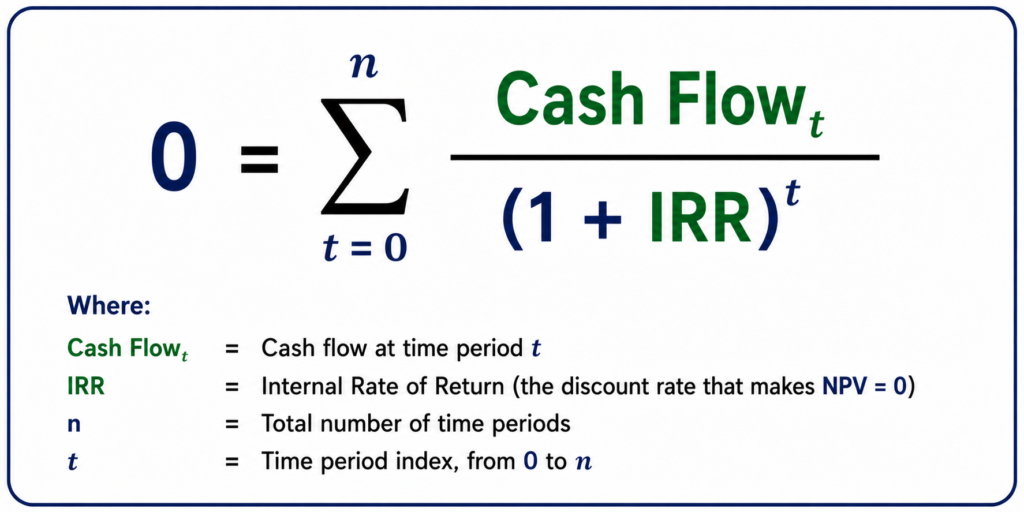
If a project’s IRR exceeds the company’s internal hurdle rate, the initiative is financially viable. IRR allows executives to compare projects of varying sizes on a standardized percentage scale.
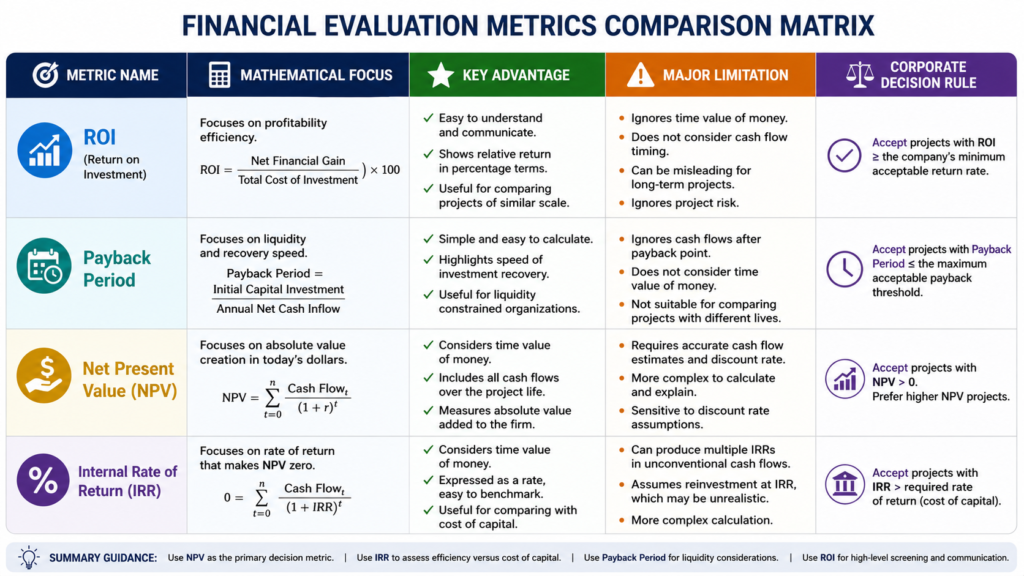
Comparative Decision Matrix: Capital Budgeting Methods
Step-by-Step Implementation Framework for Project Leaders
To evaluate competing capital projects with absolute objectivity, project managers should follow this repeatable five-stage framework.
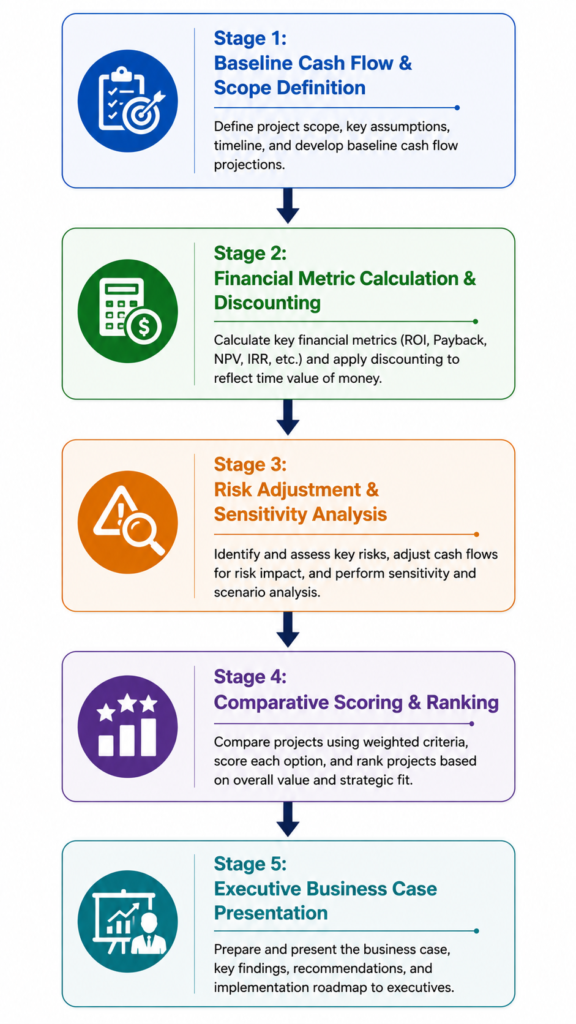
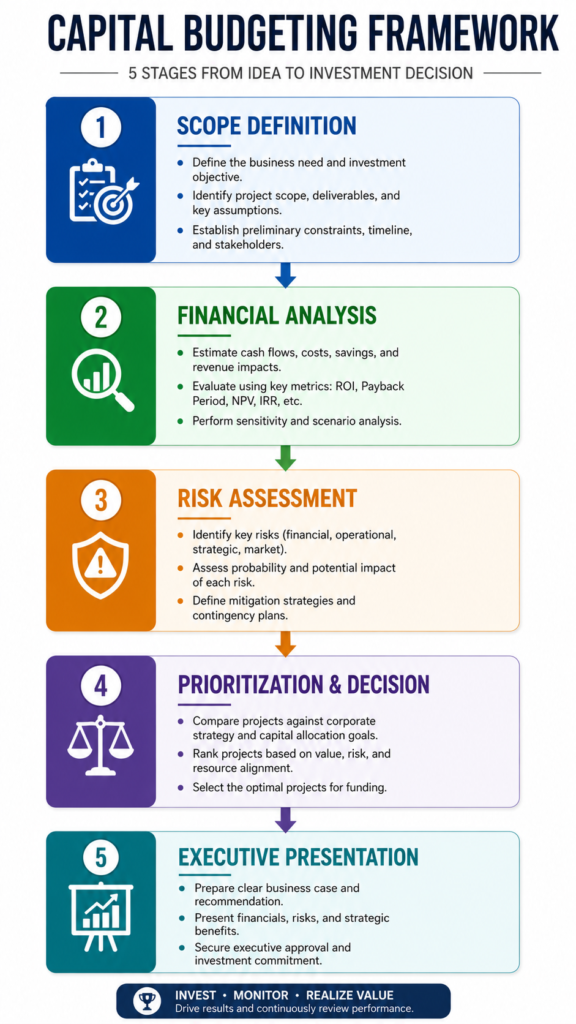
Stage 1: Establish Incremental Cash Flow Baselines
Isolate true financial cash flows rather than accounting profits. Focus strictly on incremental cash flows: cash that flows into or out of the firm specifically because the project is undertaken.
Initial Outlay (Year 0): Include software licenses, hardware procurement, vendor integration costs, initial onboarding, and internal labor overhead.
Operating Cash Inflows (Years 1 to N): Quantify direct revenue expansion, labor savings, error reduction costs, and infrastructure consolidation.
Terminal Value (Year N): Account for software residual value, hardware salvage, or ongoing maintenance costs required to maintain operations.
Stage 2: Execute Capital Budgeting Calculations
Run the core quantitative modeling using standardized corporate parameters:
Obtain the corporate hurdle rate or WACC from the finance department (for example, 10%).
Calculate the annual net cash flow for each period ($\text{Inflows} – \text{Outflows}$).
Compute Discounted Cash Flows for each year using the discount formula.
Sum the discounted cash flows and subtract the initial investment to derive the Net Present Value.
Determine the IRR and Payback Period.
Stage 3: Perform Risk & Sensitivity Analysis
Financial forecasts are hypotheses. Test the resilience of your business case by varying core inputs:
Pessimistic Scenario: What happens to NPV if user adoption falls 30% below projections and development costs increase by 15%?
Sensitivity Testing: Identify which single variable (for example, implementation timeline, monthly subscription pricing, or labor reduction rate) exerts the greatest impact on NPV.
Stage 4: Head-to-Head Project Evaluation
When choosing between competing projects, line up their financial metrics side-by-side.
Real-World Corporate Scenario: Project Alpha vs. Project Beta
Imagine your PMO must select between two competing digital transformation initiatives. The company’s required hurdle rate is 10%, and the maximum acceptable payback threshold is 3.5 years. Total available capital is $1,000,000.
Project Alpha (E-Commerce Storefront Redesign):
Initial Outlay: $1,000,000
Year 1 Cash Inflow: $500,000
Year 2 Cash Inflow: $450,000
Year 3 Cash Inflow: $300,000
Year 4 Cash Inflow: $100,000
Project Beta (Automated Supply Chain Refactoring):
Initial Outlay: $1,000,000
Year 1 Cash Inflow: $200,000
Year 2 Cash Inflow: $400,000
Year 3 Cash Inflow: $600,000
Year 4 Cash Inflow: $500,000
Financial Analysis Breakdown
Project Alpha Cash Flows:
Year 0: -$1,000,000
Year 1: +$500,000 (PV at 10% = $454,545)
Year 2: +$450,000 (PV at 10% = $371,901)
Year 3: +$300,000 (PV at 10% = $225,394)
Year 4: +$100,000 (PV at 10% = $68,301)
Cumulative Un-discounted Inflows: $1,350,000
NPV at 10%: $120,141
IRR: 16.8%
Payback Period: 2.17 Years
Project Beta Cash Flows:
Year 0: -$1,000,000
Year 1: +$200,000 (PV at 10% = $181,818)
Year 2: +$400,000 (PV at 10% = $330,579)
Year 3: +$600,000 (PV at 10% = $450,789)
Year 4: +$500,000 (PV at 10% = $341,507)
Cumulative Un-discounted Inflows: $1,700,000
NPV at 10%: $304,693
IRR: 20.3%
Payback Period: 2.67 Years
Decision Rationale
If the PMO evaluated these projects based solely on traditional Payback Period, they would choose Project Alpha because it recovers its initial outlay faster (2.17 years vs. 2.67 years).
However, Project Beta delivers more than double the Net Present Value ($304,693 vs. $120,141) and a significantly higher Internal Rate of Return (20.3% vs. 16.8%). Because Project Beta creates substantially more long-term shareholder value while comfortably staying within the 3.5-year payback limit, executive leadership must select Project Beta.
Stage 5: Present the Financial Narrative to Steering Committees
Translate complex spreadsheet outputs into an executive summary narrative:
State the primary financial recommendation clearly in the first slide.
Frame the investment around value creation, capital efficiency, and risk mitigation.
Present the sensitivity analysis transparently, proving that the project remains financially positive even under adverse operating conditions.

Shift From Operational Chaos to Strategic Leadership
When you master capital budgeting techniques, the trajectory of your project management career changes completely.
You no longer find yourself defending reactive schedule delays or fighting over ambiguous scope additions. By validating business cases with financial rigor before work starts, you ensure that every sprint, milestone, and deliverable aligns directly with bottom-line executive priorities.
This financial clarity protects your engineering teams from wasted cycles, eliminates low-value pet projects, and establishes predictable delivery across your portfolio. You move from answering questions about task status to shaping conversations around corporate resource allocation.
Learning project management the right way means understanding the financial drivers behind corporate governance. When you can fluently converse with CFOs, business sponsors, and executive boards in the language of ROI, NPV, and capital efficiency, you stop being viewed as an administrative tracking resource and step into your role as a strategic business leader.
Accelerate Your Executive Career with Skillsetify
If you are ready to stop guessing, move up the corporate ladder, and learn project management the right way, reach out to Skillsetify. We do not just teach frameworks: we show you your exact career growth trajectory.
Mastering advanced business case validation, financial analysis, and portfolio governance is the fastest route to executive leadership positions. Partner with Skillsetify today to elevate your skill set, command respect in the boardroom, and lead high-stakes enterprise projects with complete confidence.